Dashboard & Analytics
Turn maintenance data into clear decisions
Track KPIs, costs, and work trends in dashboards linked to your assets, work orders, and time data.

Our customers

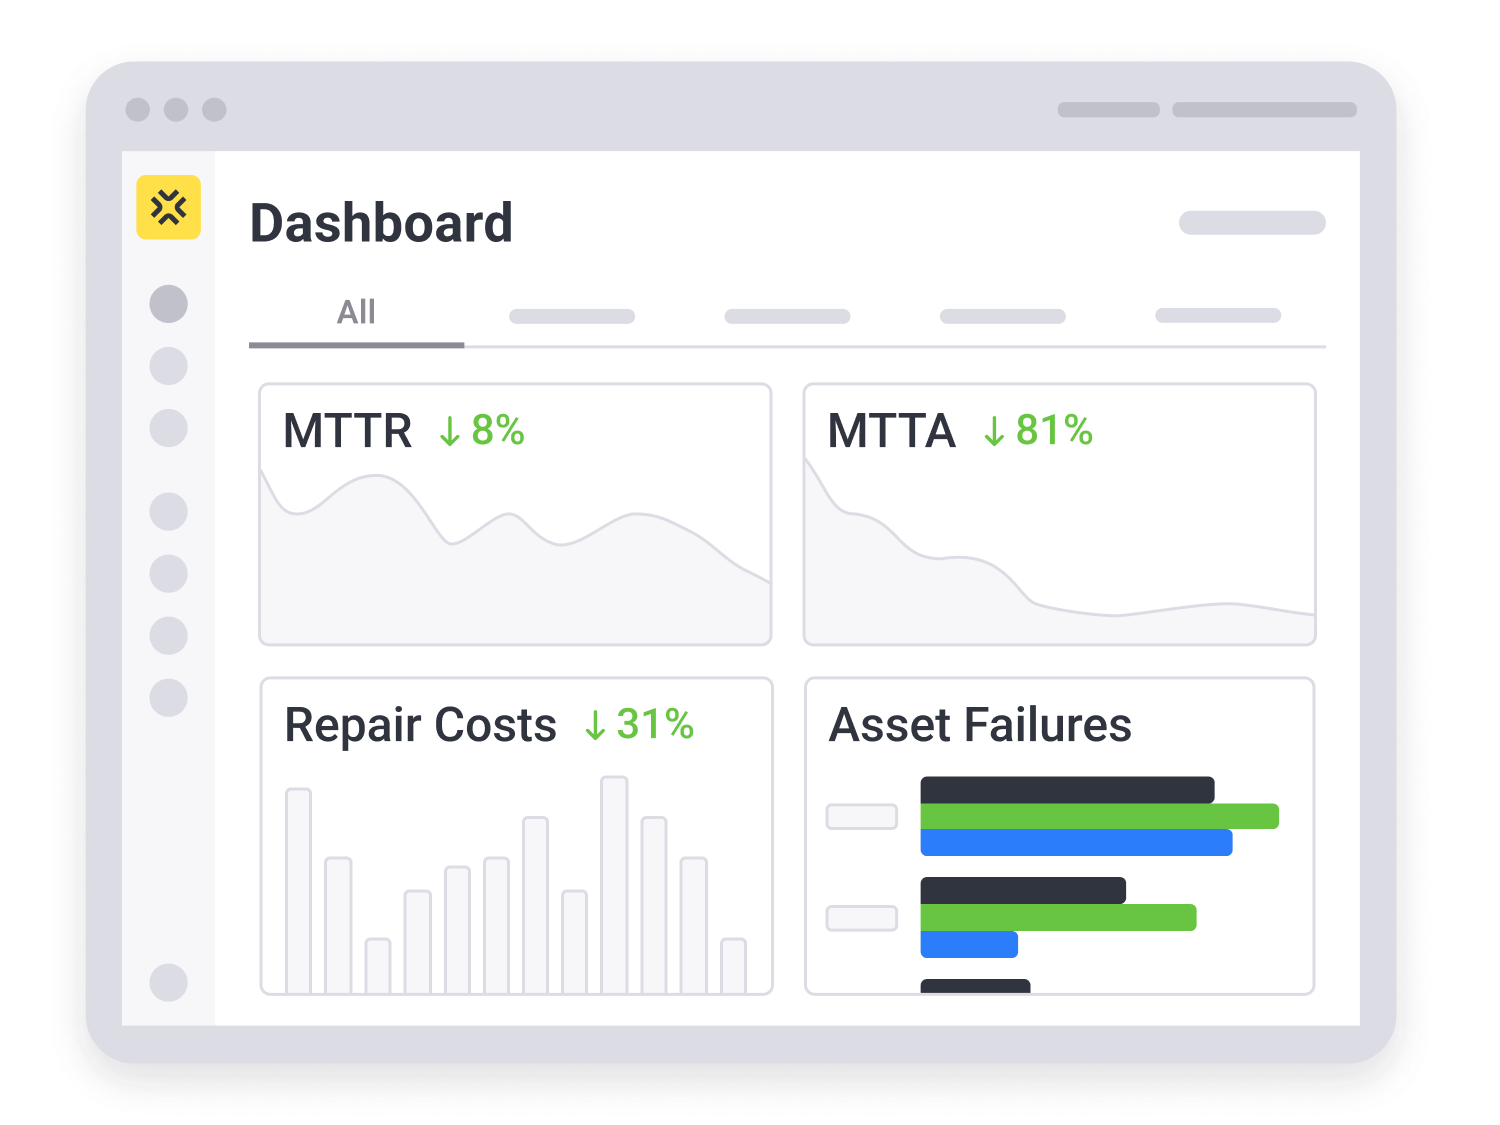
Measure critical performance KPIs
Track MTTR, MTTA, and MTTC to see how how fast teams respond, and give accurate estimates to operation teams.
Compare preventive and reactive work ratios to adjust priorities and reduce urgent jobs.
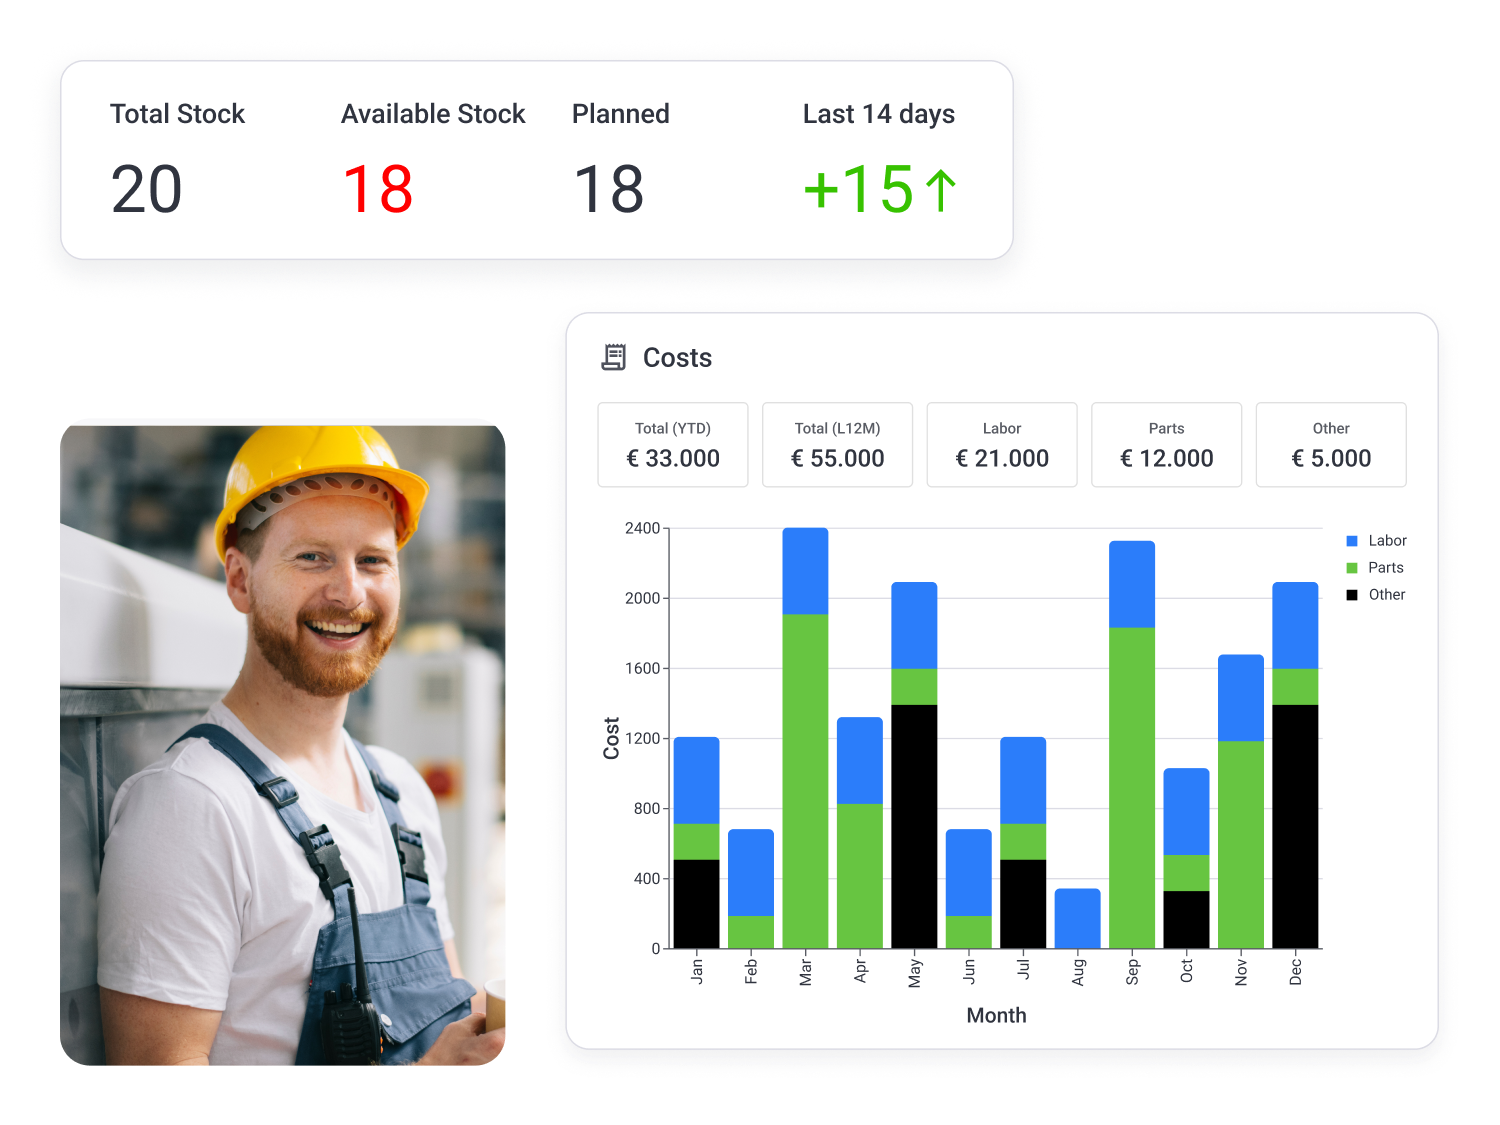
Build maintenance cost visibility
Track labour, parts, and other costs on each work order so you can see what maintenance really costs.
Group by cost centre and yearly asset totals to guide budgets and repair-vs-replace decisions.
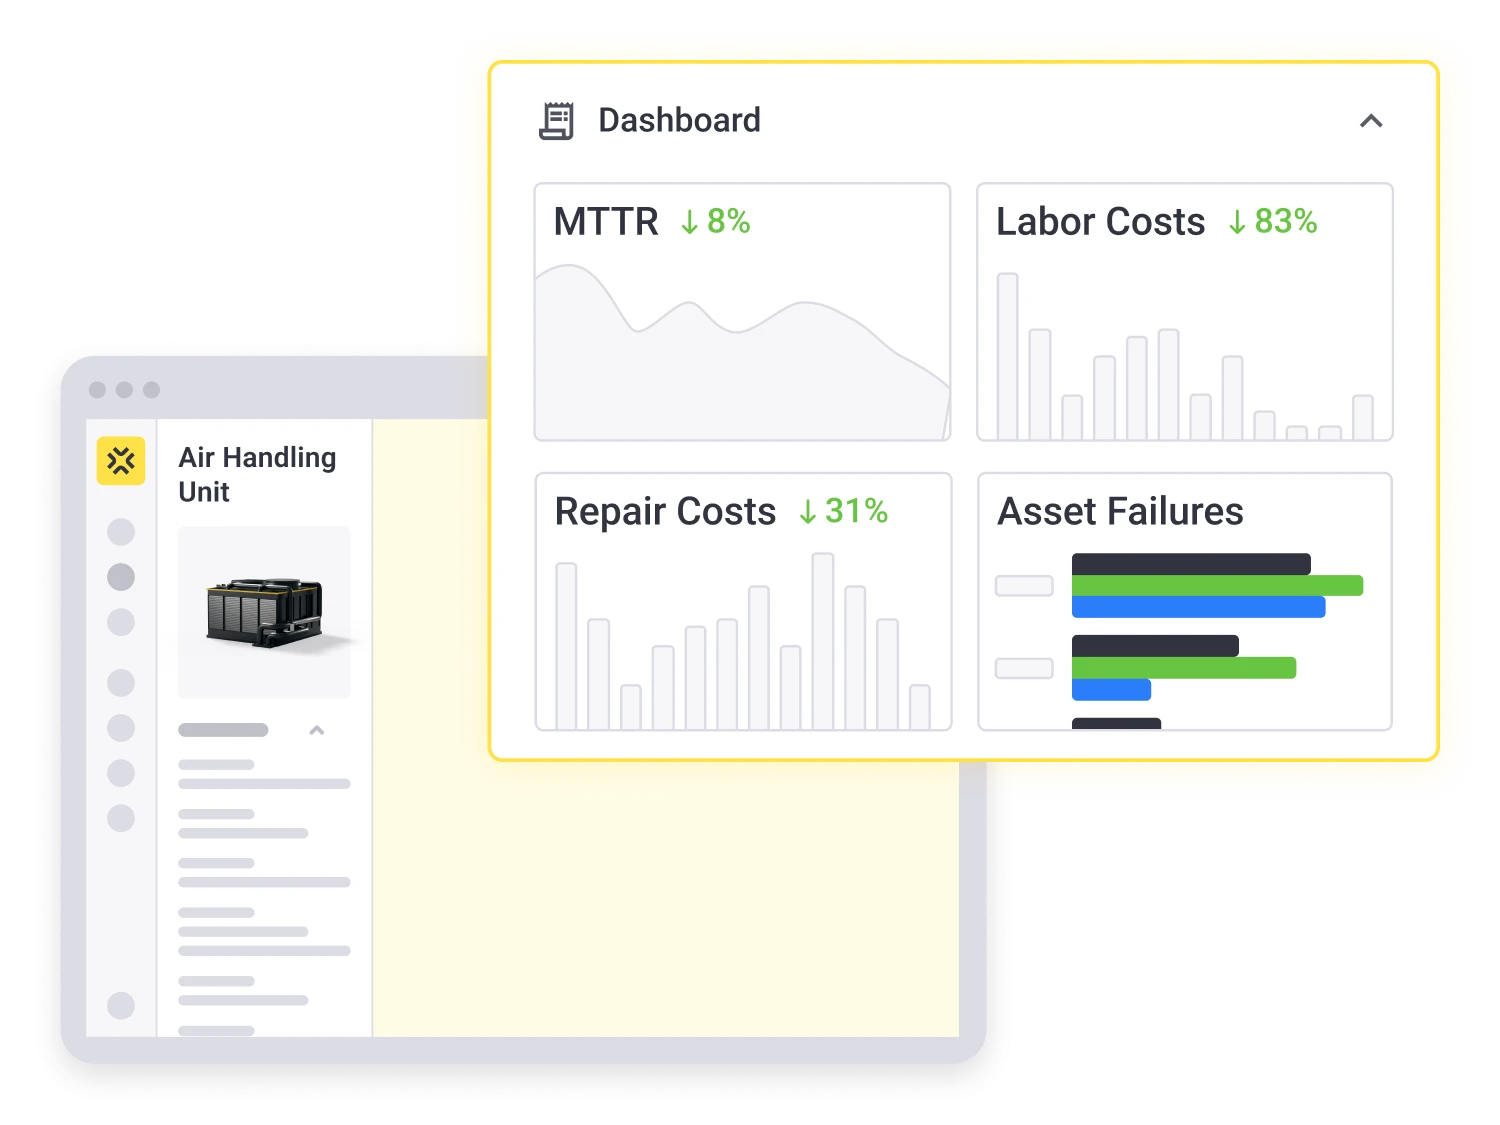
See an asset’s KPIs in context
View reliability KPIs in the context of the asset you are viewing or working on.
Open its signals or activities to see what could be causing changes in performance.
Spot patterns from past work
Review patterns in work requests, work orders, and tracked time to get a overall view of usage and health.
Use these trends to rebalance capacity and reduce recurring bottlenecks.
Customer Voices


.png)
Connect your IT systems through Interfaces & APIs
remberg can be connected to all common ERP or MES systems to enable a mobile, AI-powered user experience for maintenance teams. Find out more about our documented interfaces in our remberg developer portal.
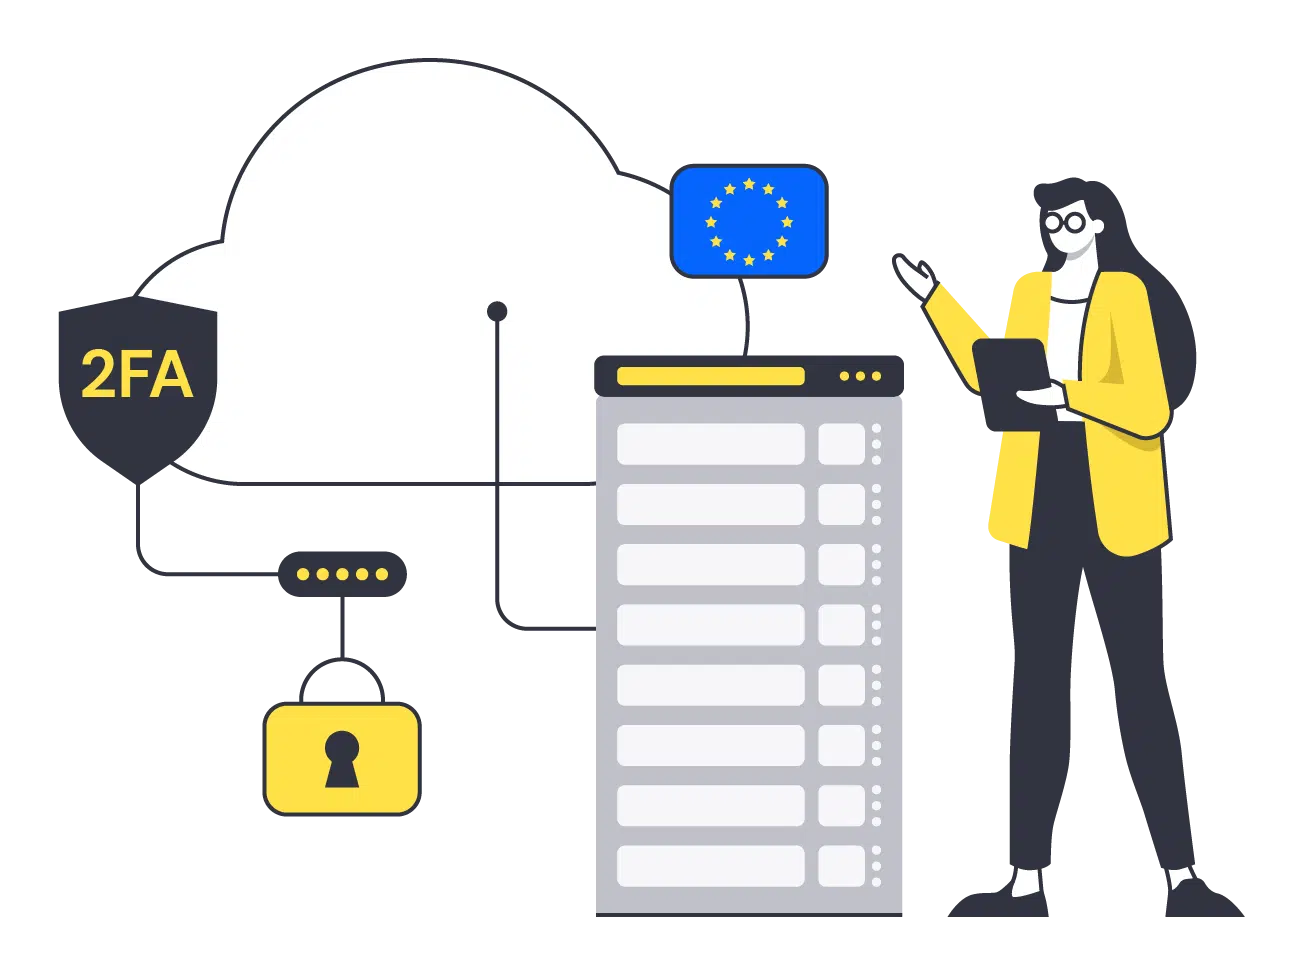
Trust in world-class data protection & IT security
Your data and your trust are our top priority. For hosting, the remberg software relies on a German high-security data center that is ISO/IEC 27001 certified and meets the highest C5 standards of the German Federal Office for Information Security (BSI). Additionally remberg provides security mechanisms such as password change cycles and 2FA.
Our Customers


Dashboard FAQs
Which maintenance software displays MTBF and fault data?
What matters is not which software displays MTBF on a dashboard, but which software captures the underlying data cleanly. Reliable MTBF values require three foundations: structured fault logging with a list of 15 to 20 mandatory root cause codes, automatic timestamps at the asset (for example via QR scan), and a real operating time reference from a shift schedule or machine signal. Without one of these, the metric remains an estimate, no matter how the dashboard looks.
In remberg, MTTR, MTTA, maintenance costs, and failures per asset are visible on the dashboard today, together with the full incident history on the asset detail page. MTBF follows the same logic and will be added once the operating time reference per asset is configured in the system.